Anúncios
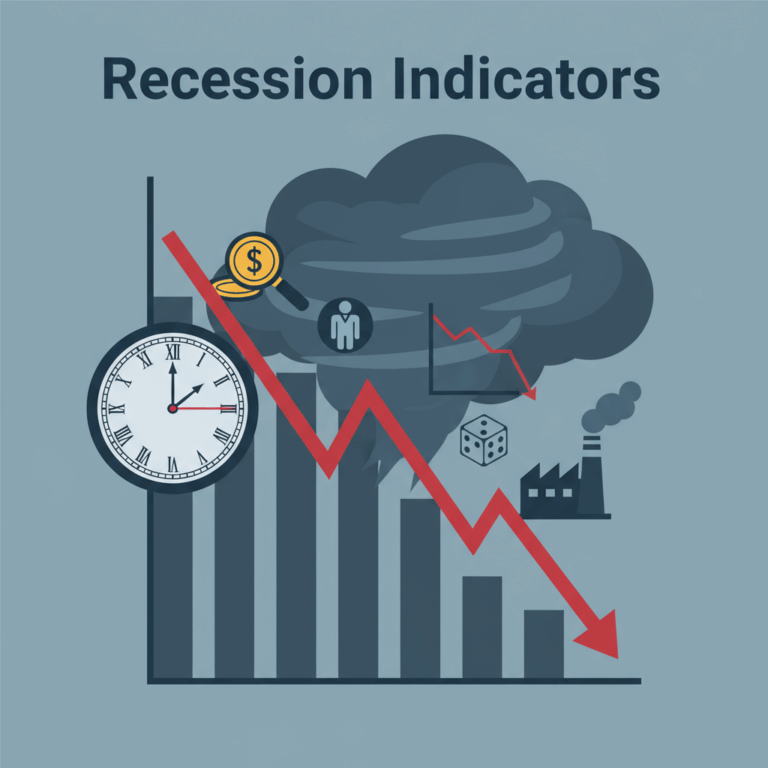
Types of Recession Indicators
Recession indicators are categorized as leading, lagging, or coincident based on their timing relative to economic cycles. Each type signals economic changes differently.
Understanding these categories helps in interpreting economic data to forecast downturns accurately. Leading indicators hint at future trends, while lagging confirm past shifts.
Anúncios
Coincident indicators monitor the economy’s current state, offering real-time data that supports other signals in recession analysis.
Leading Indicators and Their Importance
Leading indicators provide early warnings about potential recessions by signaling future economic slowdowns. They are crucial for proactive decision-making.
Anúncios
Examples include the inverted yield curve and declining consumer confidence, which often precede economic contractions by months.
These indicators help policymakers and businesses adjust strategies to mitigate recession impacts before the downturn intensifies.
Lagging and Coincident Indicators Explained
Lagging indicators confirm economic trends after they occur, reflecting changes with a delay. Unemployment rate rises typically fall into this category.
Coincident indicators move simultaneously with the economy, such as real GDP or stock market performance, providing real-time insights on economic health.
Using lagging and coincident indicators alongside leading ones enhances accuracy in tracking and understanding recessions.
Key Leading Economic Signals
Key leading economic signals provide early warnings of potential recessions by reflecting future economic activity. These indicators help anticipate downturns before they fully manifest.
Among these, the inverted yield curve is especially notable due to its historical accuracy in signaling upcoming recessions. Other signals include consumer sentiment and production shifts.
Monitoring these indicators aids investors, businesses, and policymakers in preparing for economic changes and minimizing adverse effects.
Inverted Yield Curve as a Predictor
The inverted yield curve occurs when short-term interest rates exceed long-term rates, contrary to normal expectations. This reversal often signals market fears of slowing economic growth.
Historically, an inverted yield curve has preceded nearly every U.S. recession since the 1950s, acting as a reliable ahead-of-time indicator by reflecting investor expectations of future declines.
This signal suggests tightening credit conditions and reduced lending incentives, which can constrain business expansion and consumer spending, triggering recession risks.
Declining Consumer Confidence
Consumer confidence measures how optimistic people feel about the economy. A declining trend indicates worries about income, jobs, or economic prospects, leading to decreased spending.
Since consumer spending drives a large portion of economic activity, falling confidence often signals an upcoming slowdown, as cautious consumers reduce discretionary purchases and investments.
Tracking confidence indexes gives early insight into household behaviors, enabling timely policy responses to stabilize growth or stimulate demand.
Slowing Manufacturing Activity
Manufacturing activity reflects economic health through production and orders. A slowdown, often seen when indexes like the ISM Manufacturing fall below 50, suggests contraction in this sector.
This early decline signals reduced demand, inventory overhangs, or supply chain issues, which can ripple through the economy, leading to job cuts and lower investment.
Monitoring output and new orders helps alert analysts to diminishing industrial strength before recessions fully develop.
Falling Corporate Profits
Declining corporate profits signal weakening business conditions. Reduced earnings limit companies’ ability to invest and may prompt layoffs, amplifying economic slowdowns.
Profit drops often precede recessions as firms react to lower demand by cutting costs, delaying expansion, or reducing hiring, which impacts overall economic momentum.
Profit trends thus serve as a crucial early warning sign, highlighting potential downturns in business activity and employment.
Lagging and Coincident Recession Signals
Lagging and coincident indicators provide confirmation or real-time snapshots of recessions. They help verify if a downturn is underway or how deep it is.
While they don’t predict recessions early, these signals are vital for understanding the recession’s impact and guiding policy or business reactions accordingly.
Combining these with leading indicators improves overall economic forecasting accuracy and response strategies.
Rising Unemployment Rates
Rising unemployment rates are classic lagging indicators that confirm recession conditions. As businesses face weaker demand, job cuts increase.
Unemployment typically rises after other signals appear, reflecting labor market stress due to shrinking economic activity and corporate cost-cutting.
The increase signals hardship for households and dampens consumer spending, deepening economic contraction until recovery begins.
Declines in Real GDP and Stock Market
Declines in real GDP represent a direct measure of economic contraction, often confirmed after a recession starts. This data shows reduced production and services.
Stock market declines of 20% or more usually coincide with recessions, reflecting lowered investor confidence and expectations of weaker corporate earnings.
While markets may anticipate downturns, their drops during recessions confirm economic distress, affecting household wealth and investment spending.
Credit Spreads and Business Spending
Widening credit spreads indicate increased borrowing risks perceived by lenders, signaling tighter financial conditions during recessions.
Reduced business spending occurs as companies delay investments due to uncertainty, weakening economic growth and prolonging downturn effects.
Together, these signals highlight restricted credit availability and cautious corporate behavior, key factors in extending recession durations.
Combining Indicators for Recession Prediction
Combining multiple recession indicators enhances the accuracy of predicting economic downturns. Relying on a single signal can be misleading due to unique market conditions.
Integrating leading, lagging, and coincident signals allows analysts to build a more comprehensive and timely picture of economic health and potential recession risks.
This approach helps differentiate false alarms from genuine threats by cross-verifying data from different economic sectors and time frames.
Effectiveness of Multiple Signals
Using multiple economic indicators together improves the reliability of recession forecasts. When several key signals align, the likelihood of a recession increases significantly.
For example, an inverted yield curve paired with falling consumer confidence and slowing manufacturing strengthens the recession prediction compared to isolated signals.
This combined method reduces the risk of false positives, aiding investors and policymakers in making better-informed decisions before recessions occur.
Research shows that multi-indicator models outperform single-indicator approaches in anticipating downturns earlier and with greater certainty.
Applications for Policy and Decision-Making
Accurate recession predictions assist governments and central banks in implementing timely monetary and fiscal policies to mitigate economic contractions.
Businesses benefit by adjusting investment plans, managing inventories, and preparing workforce strategies to navigate potential slowdowns effectively.
Practical Use in Economic Planning
Combining recession indicators supports proactive risk management. Policymakers can stimulate demand or ease credit to soften recession effects based on reliable forecasts.
Similarly, firms can optimize cash flows and strategic priorities, reducing losses and positioning themselves advantageously when growth resumes.